Piping maintenance rarely fails because one valve is expensive. It becomes costly when small leaks, fouling, and rushed repairs repeat. In field inspections, a damp flange often signals a larger reliability problem. The drip is visible. The lost production is not. A practical cost strategy starts with risk, condition, and operating history.
This guide explores how to reduce maintenance costs for piping systems without trading safety for short-term savings. It connects inspection data with isolation planning, spare-parts control, and realistic work scheduling. Engineers should classify lines by service, pressure, temperature, consequence, and failure history. High-risk circuits deserve documented inspection intervals and qualified technicians. Lower-risk lines may need simpler checks, but assumptions require evidence. That distinction matters. A spreadsheet alone cannot hear hammering, detect vibration, or reveal a thinning elbow. Thickness measurements, condition monitoring, and disciplined records support stronger decisions than calendar-based replacement. Applicable engineering codes and manufacturer guidance should also anchor the maintenance plan.
Reliable programs examine why work orders recur. A gasket replaced three times may indicate misalignment, vibration, poor bolting, or unsuitable material. Correcting the cause usually costs less than repeating the symptom. However, preventive maintenance is not automatically economical. Some intervals become outdated. A thoughtful review compares labor, downtime, failure exposure, and inspection quality. The goal is not fewer maintenance tasks at any price. It is safer, more predictable piping performance with defensible spending decisions. Even experienced teams miss details. That is why effective programs leave room for measurement, challenge, and correction.
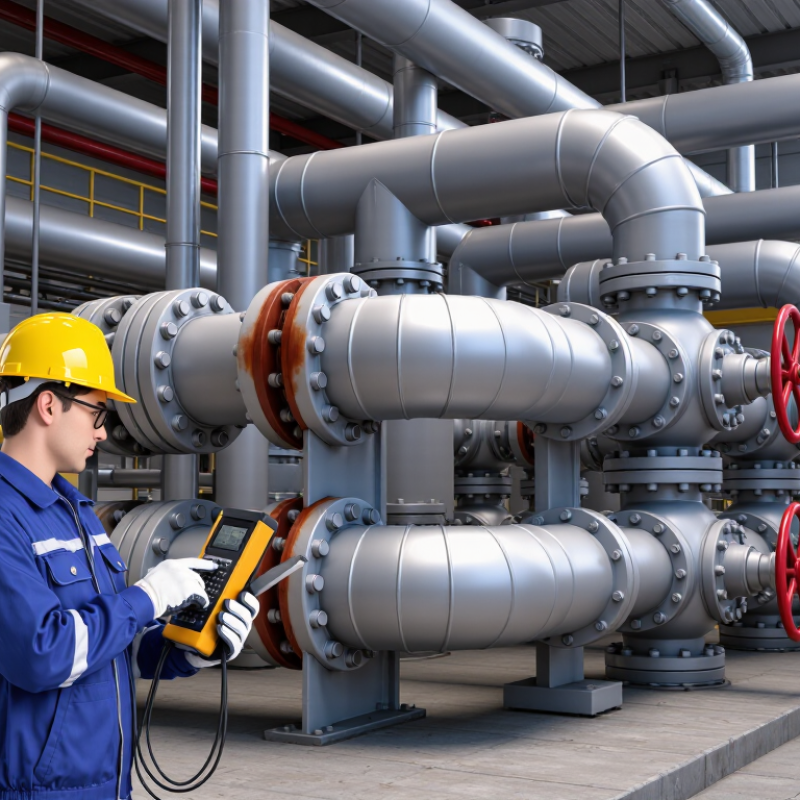
The main source of piping maintenance cost is often corrosion, not the replacement itself. The NACE IMPACT study estimated global corrosion costs at approximately 2.5 trillion dollars annually, equal to 3.4% of global GDP. It also reported that 15% to 35% of corrosion costs could be reduced through better control practices. In a plant, this may appear as a thin spot beneath wet insulation, a leaking flange, or corrosion inside a stagnant branch. Corrosion wins quietly.
Erosion creates another costly pattern. High-velocity fluids, suspended solids, and repeated flow changes can thin elbows, reducers, and control valves. Vibration then loosens supports and accelerates fatigue at welded connections. API 570 inspection guidance emphasizes inspection planning, thickness monitoring, and risk-based evaluation. Yet many facilities still inspect visible areas more often than hidden ones. Access is expensive. Removing insulation, scaffolding, and isolating equipment can cost more than the repair.
Poor records also inflate maintenance spending. Missing thickness histories make engineers repeat inspections. Unclear drawings delay isolation and extend shutdown work. The ISO 14224 framework shows why consistent equipment and failure data matter for reliability analysis. Maintenance teams should separate corrosion, erosion, vibration, design flaws, and access costs in each work order. Records lie sometimes, especially after undocumented modifications. A practical review should compare inspection findings, labor hours, spare parts, production losses, and repeat failures. This exposes the real cost driver, rather than blaming every leak on aging pipe.
Define the main causes of piping maintenance costs to prioritize prevention, inspection, and replacement activities.
Key insight: Corrosion control and leak prevention typically offer the greatest savings opportunities because they account for the largest share of recurring piping maintenance work.
What Is the Best Way to Cut Piping Maintenance Costs?
Assess Piping Conditions and Rank Maintenance Risks
Maintenance savings begin with accurate condition assessment, not delayed repairs. The NACE IMPACT study estimated global corrosion costs at approximately $2.5 trillion annually, equal to about 3.4% of global GDP. A practical inspection program can reduce avoidable corrosion costs by 15–35%, according to the same study.
Walk the line.
Inspectors should map corrosion under insulation, thinning near elbows, vibration at supports, and leakage around flanges. Thickness readings need location history, not isolated numbers. Compare current ultrasonic measurements with previous records and calculate corrosion rates. API 570 emphasizes inspection planning based on damage mechanisms, probability, and consequences.
Risk ranking makes limited budgets more defensible. A thin pipe carrying hot, toxic, or highly pressurized fluid deserves priority over a thicker line with low consequences. Consider four factors: remaining thickness, corrosion rate, service severity, and failure impact. Use a simple scoring matrix, then review it with operations and engineering staff.
Do not trust the spreadsheet completely.
Field conditions can contradict old drawings. Insulation may hide wet surfaces, while temporary clamps can conceal recurring leaks. Risk scores also change after process modifications, shutdowns, or unusual vibration. Reassess high-risk circuits after every significant operating change. Records must show who inspected the line, what was observed, and why the ranking changed. Reliability improves when evidence supports each maintenance decision.
Preventive maintenance uses planned inspections, valve exercises, gasket replacement, and corrosion-control work.
It suits predictable deterioration, especially in aging carbon-steel lines. However, fixed intervals can waste labor and disturb healthy equipment.
The U.S. Department of Energy’s Operations and Maintenance Best Practices Guide reports 12–18% savings over reactive maintenance.
Predictive maintenance adds evidence before failure.
Ultrasonic thickness readings, vibration checks, infrared surveys, and acoustic leak detection reveal changing conditions. For piping, trend data can expose wall loss near elbows, supports, dead legs, and insulation.
The same DOE guide indicates predictive maintenance may reduce costs 8–12% beyond preventive programs. That figure is useful, not universal. Sensor placement, data quality, and technician judgment can weaken results.
Deloitte’s 2021 predictive-maintenance analysis reported potential maintenance-cost reductions of 25–30%. Treat that estimate as a planning range, not a promise.
Corrective maintenance remains necessary when a defect is minor, accessible, and safely contained.
A damaged label or noncritical drain fitting may wait for a planned outage. A rapidly growing leak cannot. Repair urgency should consider pressure, fluid hazard, consequence, and inspection history.
Risk-based prioritization prevents emergency work from controlling the budget. No method is perfect.
After every shutdown, teams should challenge inspection intervals, missed signals, and repair decisions.
Piping maintenance costs fall when teams improve inspection, repair, and replacement decisions. Reactive work often begins with a small leak, then becomes an emergency shutdown. The U.S. Department of Energy’s Operations and Maintenance Best Practices Guide cites potential savings of 12–18% from preventive maintenance compared with reactive work. Inspection data makes those savings more achievable.
Use risk-based inspection methods, such as API 570 principles, to prioritize thinning, cracking, dead legs, and high-consequence lines. Record thickness readings at fixed locations. Photograph damaged insulation and support points. Then compare trends, not isolated readings. The AMPP IMPACT study estimated global corrosion costs at about $2.5 trillion annually, or 3.4% of global GDP. It also noted that 15–35% may be avoidable through better corrosion management.
Tips: Create a simple line history for every critical circuit. Include inspection dates, thickness loss, repair materials, and temporary controls. Replace sections only when condition, risk, and remaining life support the decision. A patch may reduce today’s cost but increase tomorrow’s exposure. I have seen teams over-inspect easy-to-access piping while missing buried or poorly supported sections. That mistake is expensive. No inspection plan is perfect. Review failure assumptions after every repair, and adjust the inspection interval when field evidence disagrees.
Piping maintenance costs fall when results are measured, not assumed. Track leakage, corrosion rates, emergency work orders, downtime, and maintenance hours by asset. A simple monthly dashboard can reveal whether inspections prevent failures or merely create paperwork. The U.S. Department of Energy reports that effective operations and maintenance practices can reduce costs by 5% to 20%. That range is meaningful, but only when each saving is verified against a reliable baseline.
Use lifecycle cost as the main measure. Record installation, inspection, repair, energy loss, replacement, and disposal costs for every critical line. The AMPP IMPACT study estimated that corrosion costs the global economy about 3.4% of gross domestic product. This figure shows why small leaks and coating defects deserve attention before they become shutdown events. Set practical targets, such as reducing unplanned repairs by 15% or extending inspection intervals without increasing risk.
Our first dashboard was imperfect. We counted completed work orders, not avoided failures. That mistake was expensive. Review the data with technicians, engineers, and operations staff each month. Compare predicted failures with actual findings. Remove inspections that produce no useful decision. Increase attention where measurements show rising wall loss or repeated leakage. Continuous improvement is rarely dramatic. It is often a tighter valve, a clearer record, and one less emergency repair.
Corrosion is often the largest cost driver. It may hide beneath wet insulation or inside a stagnant branch. Leaking flanges also create avoidable work. Replacement is only part of the expense.
Fast fluids and suspended solids thin elbows, reducers, and valves. Repeated flow changes increase wear. Flow direction matters. Wall thickness can fall quietly.
Vibration can loosen supports and stress welded connections. Fatigue cracks may then develop. A loose support can damage nearby piping. Small movements matter.
Hidden sections may require insulation removal, scaffolding, and equipment isolation. Access work can exceed the repair cost. Buried lines are especially difficult. Visible areas are not always the riskiest.
Use risk-based priorities for thinning, cracking, stagnant branches, and important lines. Measure thickness at fixed locations. Photograph damaged insulation and supports. Compare trends, not single readings.
Replace it when condition, risk, and remaining life support the decision. A temporary patch may reduce today’s cost. It can increase future exposure. The cheapest repair is not always the safest choice.
Keep inspection dates, thickness readings, repair materials, and temporary controls. Include labor hours, spare parts, and production losses. Clear line histories reduce repeated inspections. Records can be wrong.
Preventive maintenance may reduce costs by roughly 12–18% compared with reactive work. Review inspection findings before leaks become emergencies. Adjust inspection intervals after failures. No plan stays perfect.
Reducing piping maintenance costs begins with understanding where expenses originate, including corrosion, leaks, vibration, poor installation, aging components, and unplanned shutdowns. A practical approach to how to reduce maintenance costs for piping systems is to assess pipeline condition regularly, identify high-risk sections, and rank maintenance priorities according to safety, reliability, operating impact, and remaining service life. This allows resources to focus on problems that could create the greatest financial or operational consequences.
An effective maintenance program combines preventive tasks, predictive monitoring, and timely corrective work. Routine inspections, condition-based testing, and accurate maintenance records can reveal developing problems before they become costly failures. Repair and replacement processes should be standardized to reduce downtime, material waste, and repeated labor. Finally, organizations should track indicators such as leak frequency, repair costs, downtime, inspection findings, and asset life extension. Reviewing these results continuously helps refine maintenance intervals, improve decision-making, and lower total lifecycle costs while maintaining safe and reliable piping performance.

Flowtera Pipe